Monthly Averages
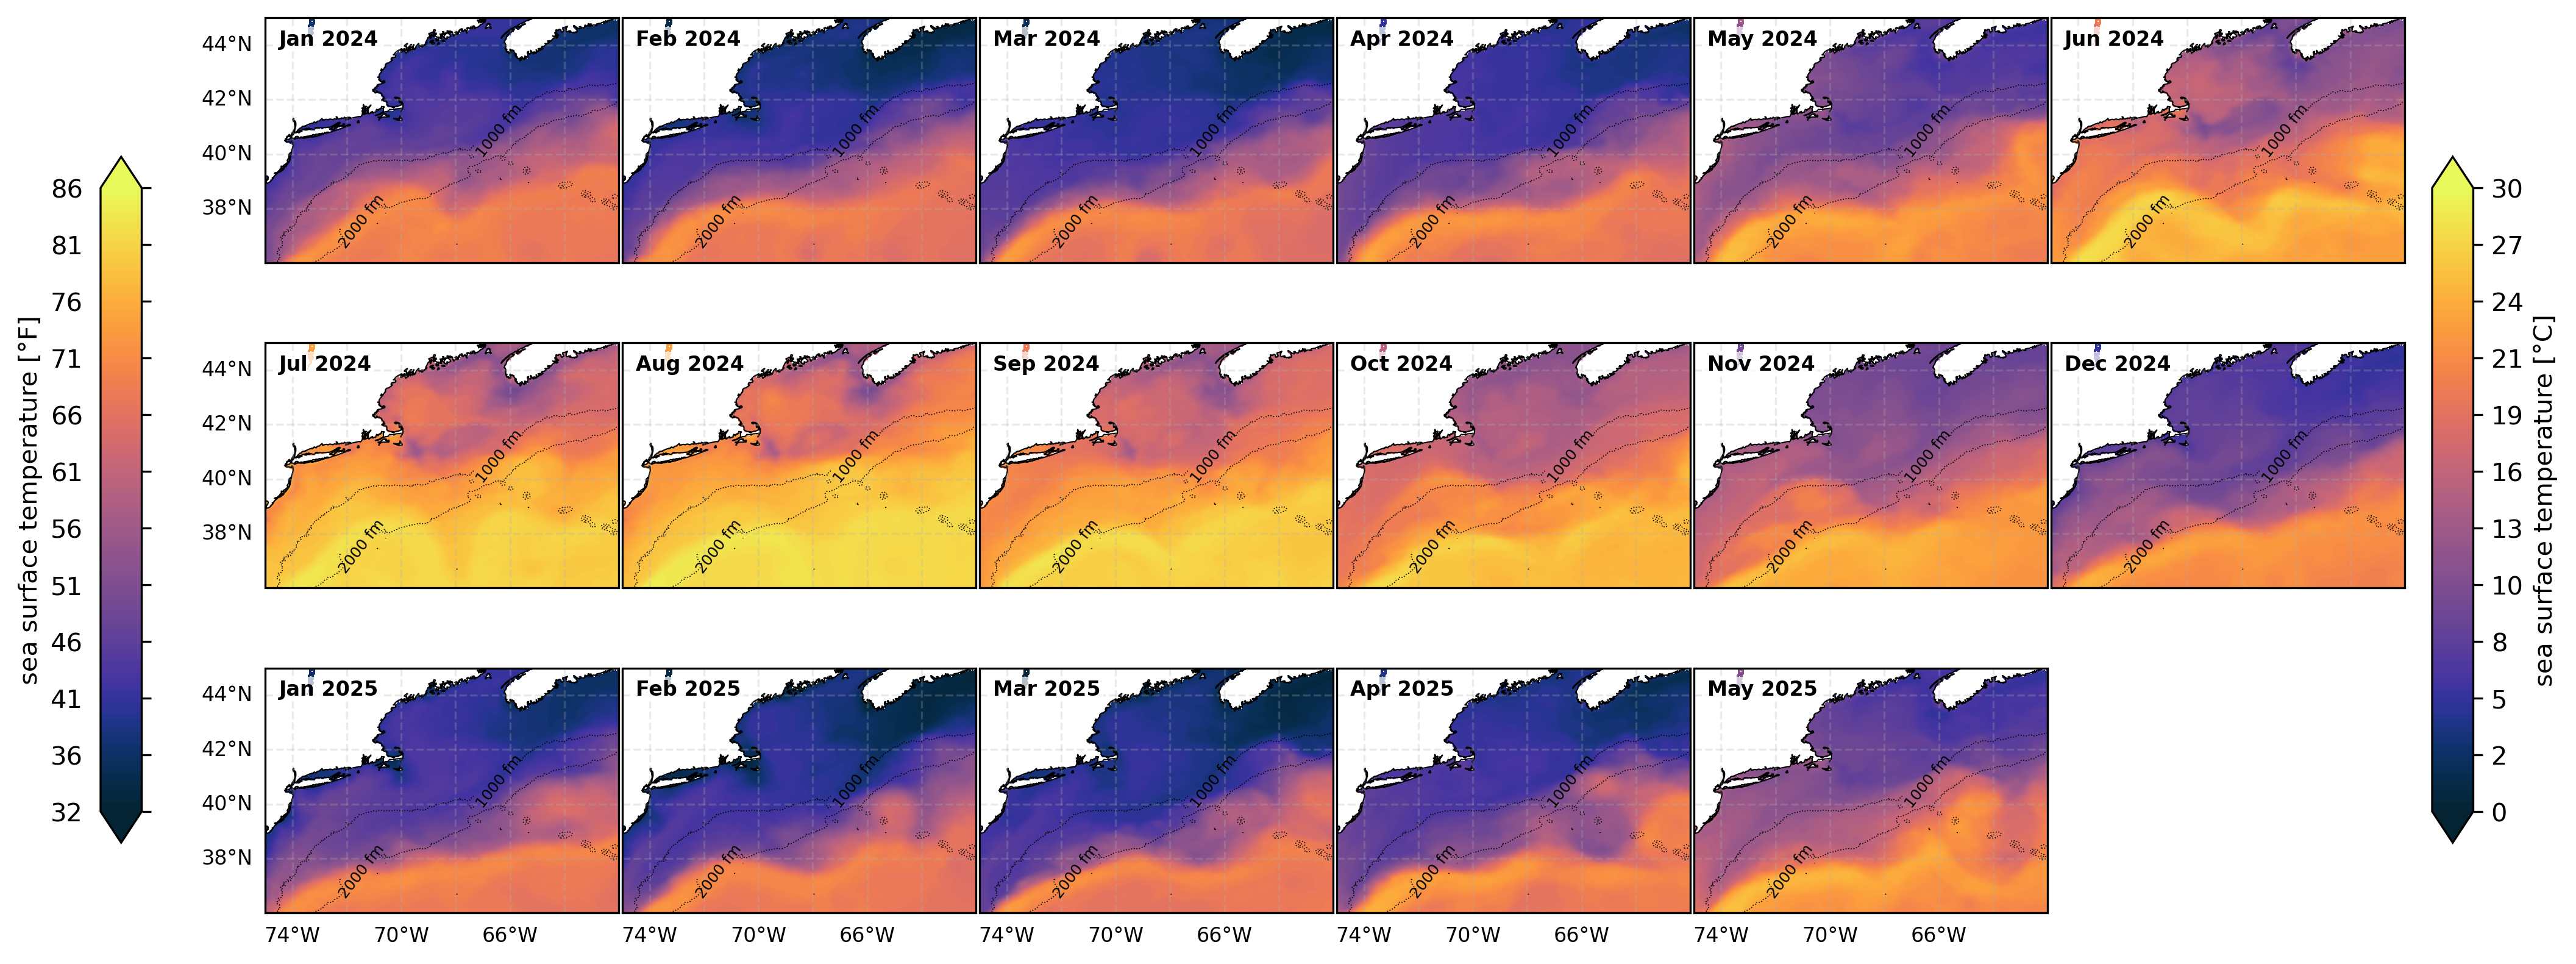
Sea Surface Temperature (SST)
Monthly average sea surface temperature from OSTIA satellite data.
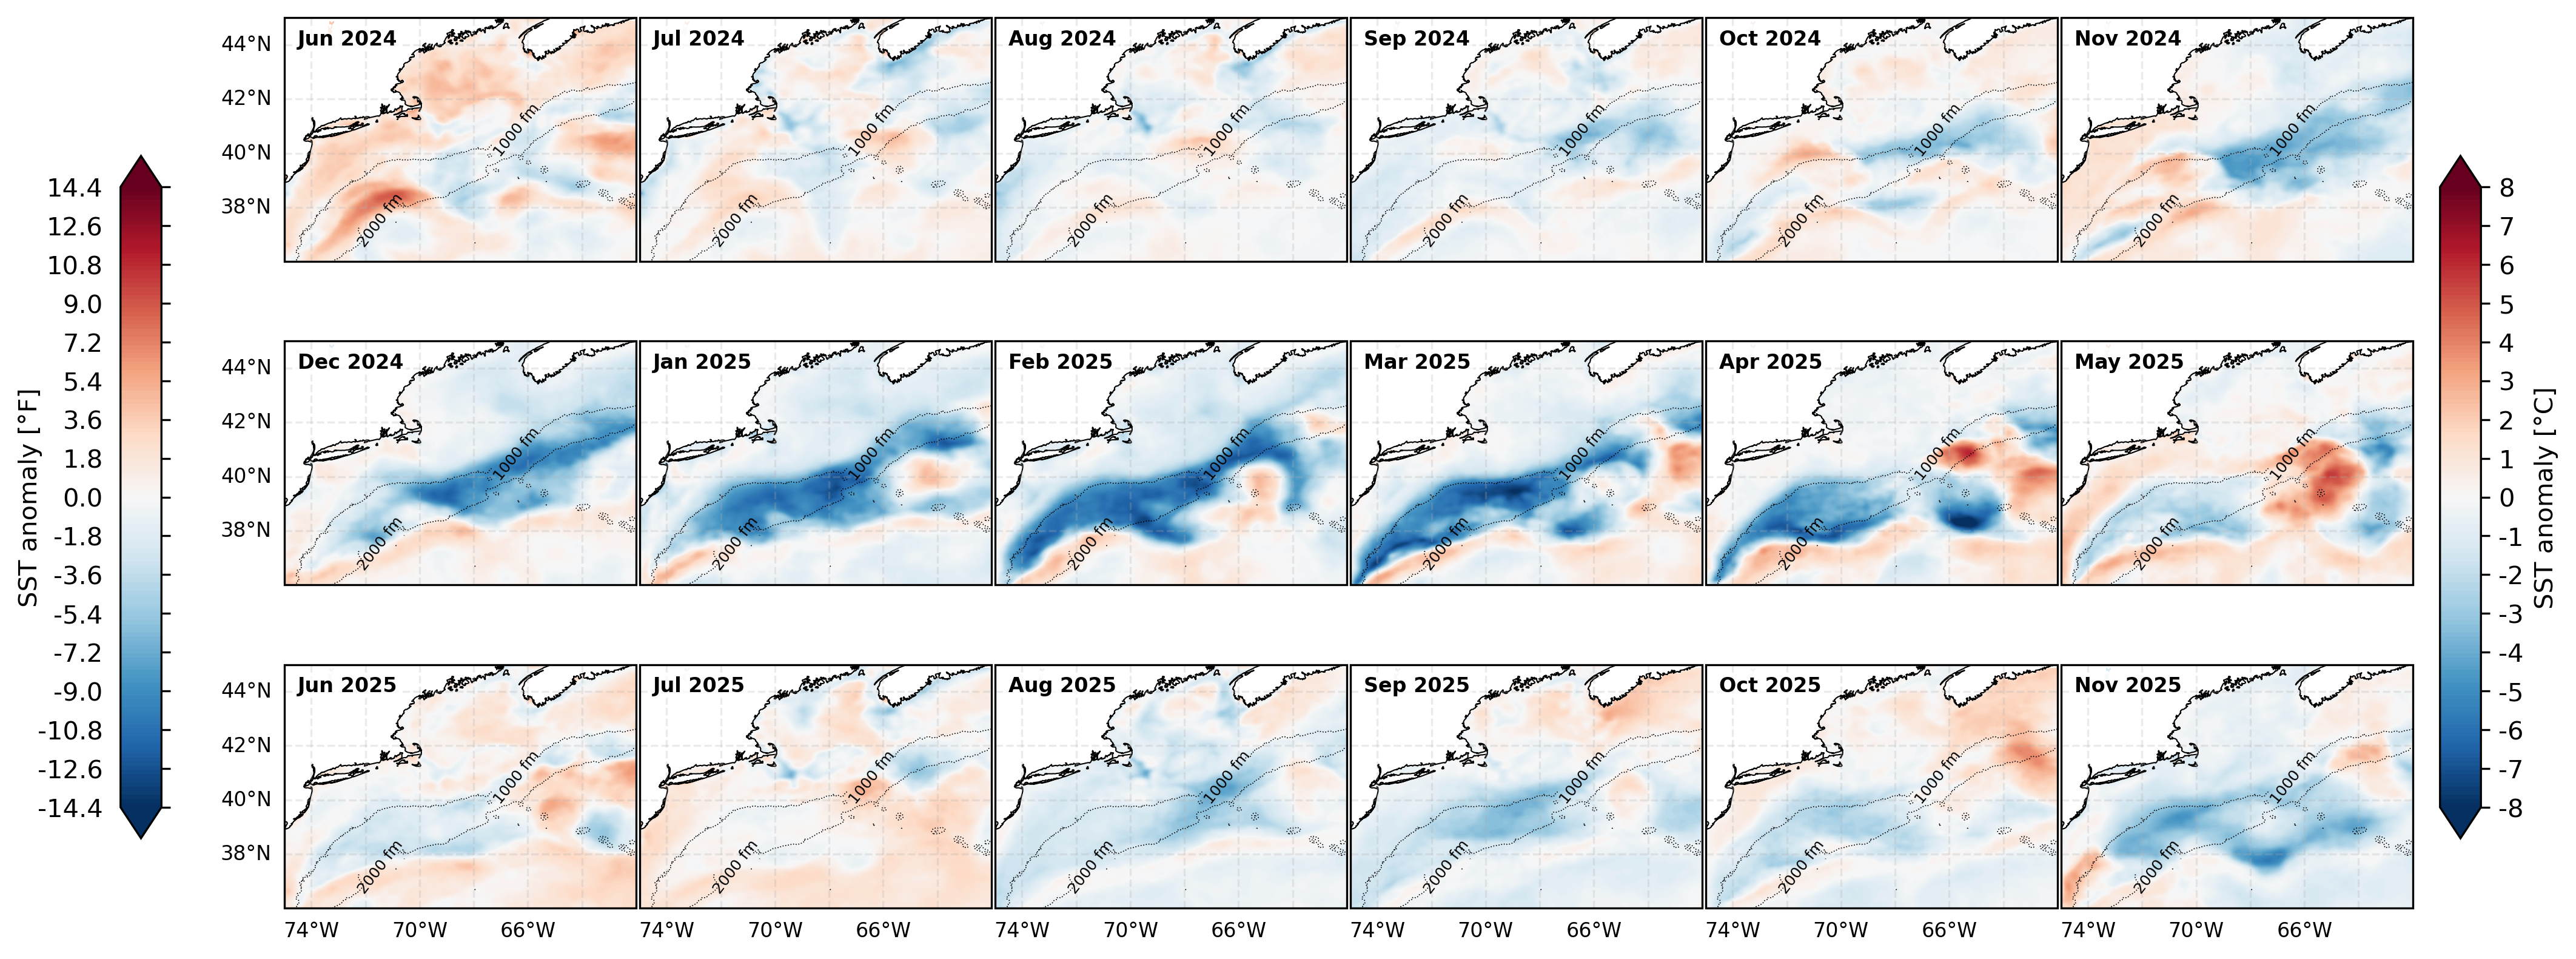
Monthly SST anomalies using OSTIA monthly averages relative to a 2007-2024 OSTIA-derived climatology.
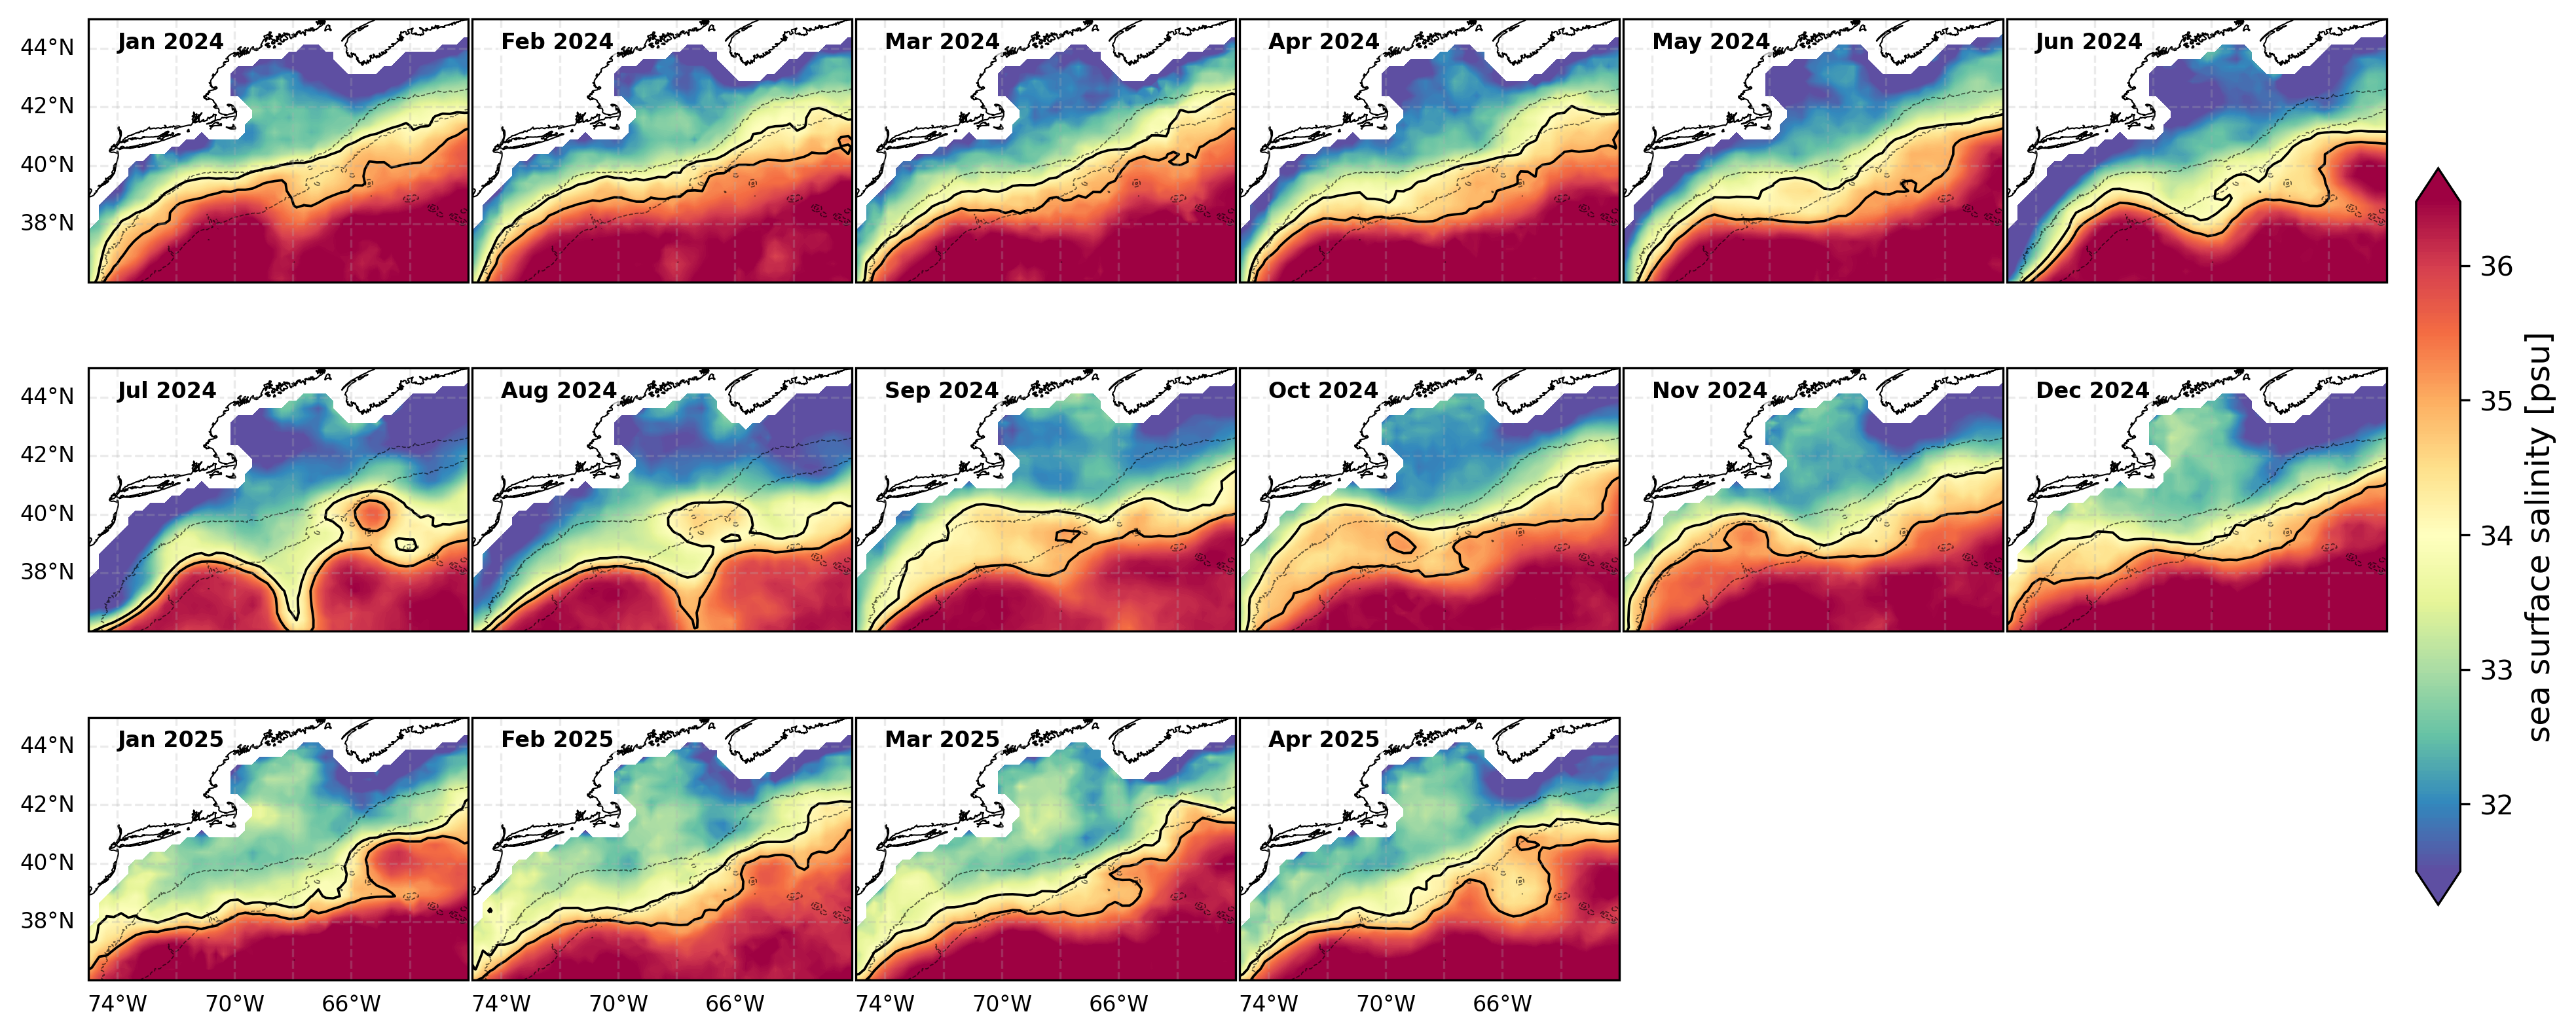
Sea Surface Salinity (SSS)
Monthly average sea surface salinity from SMAP satellite data. Salinity is measured in Practical Salinity Units (PSU), where 1 PSU is approximately 1 gram of salt per kilogram of seawater. The plots include contour lines at PSU levels of 34 and 35.
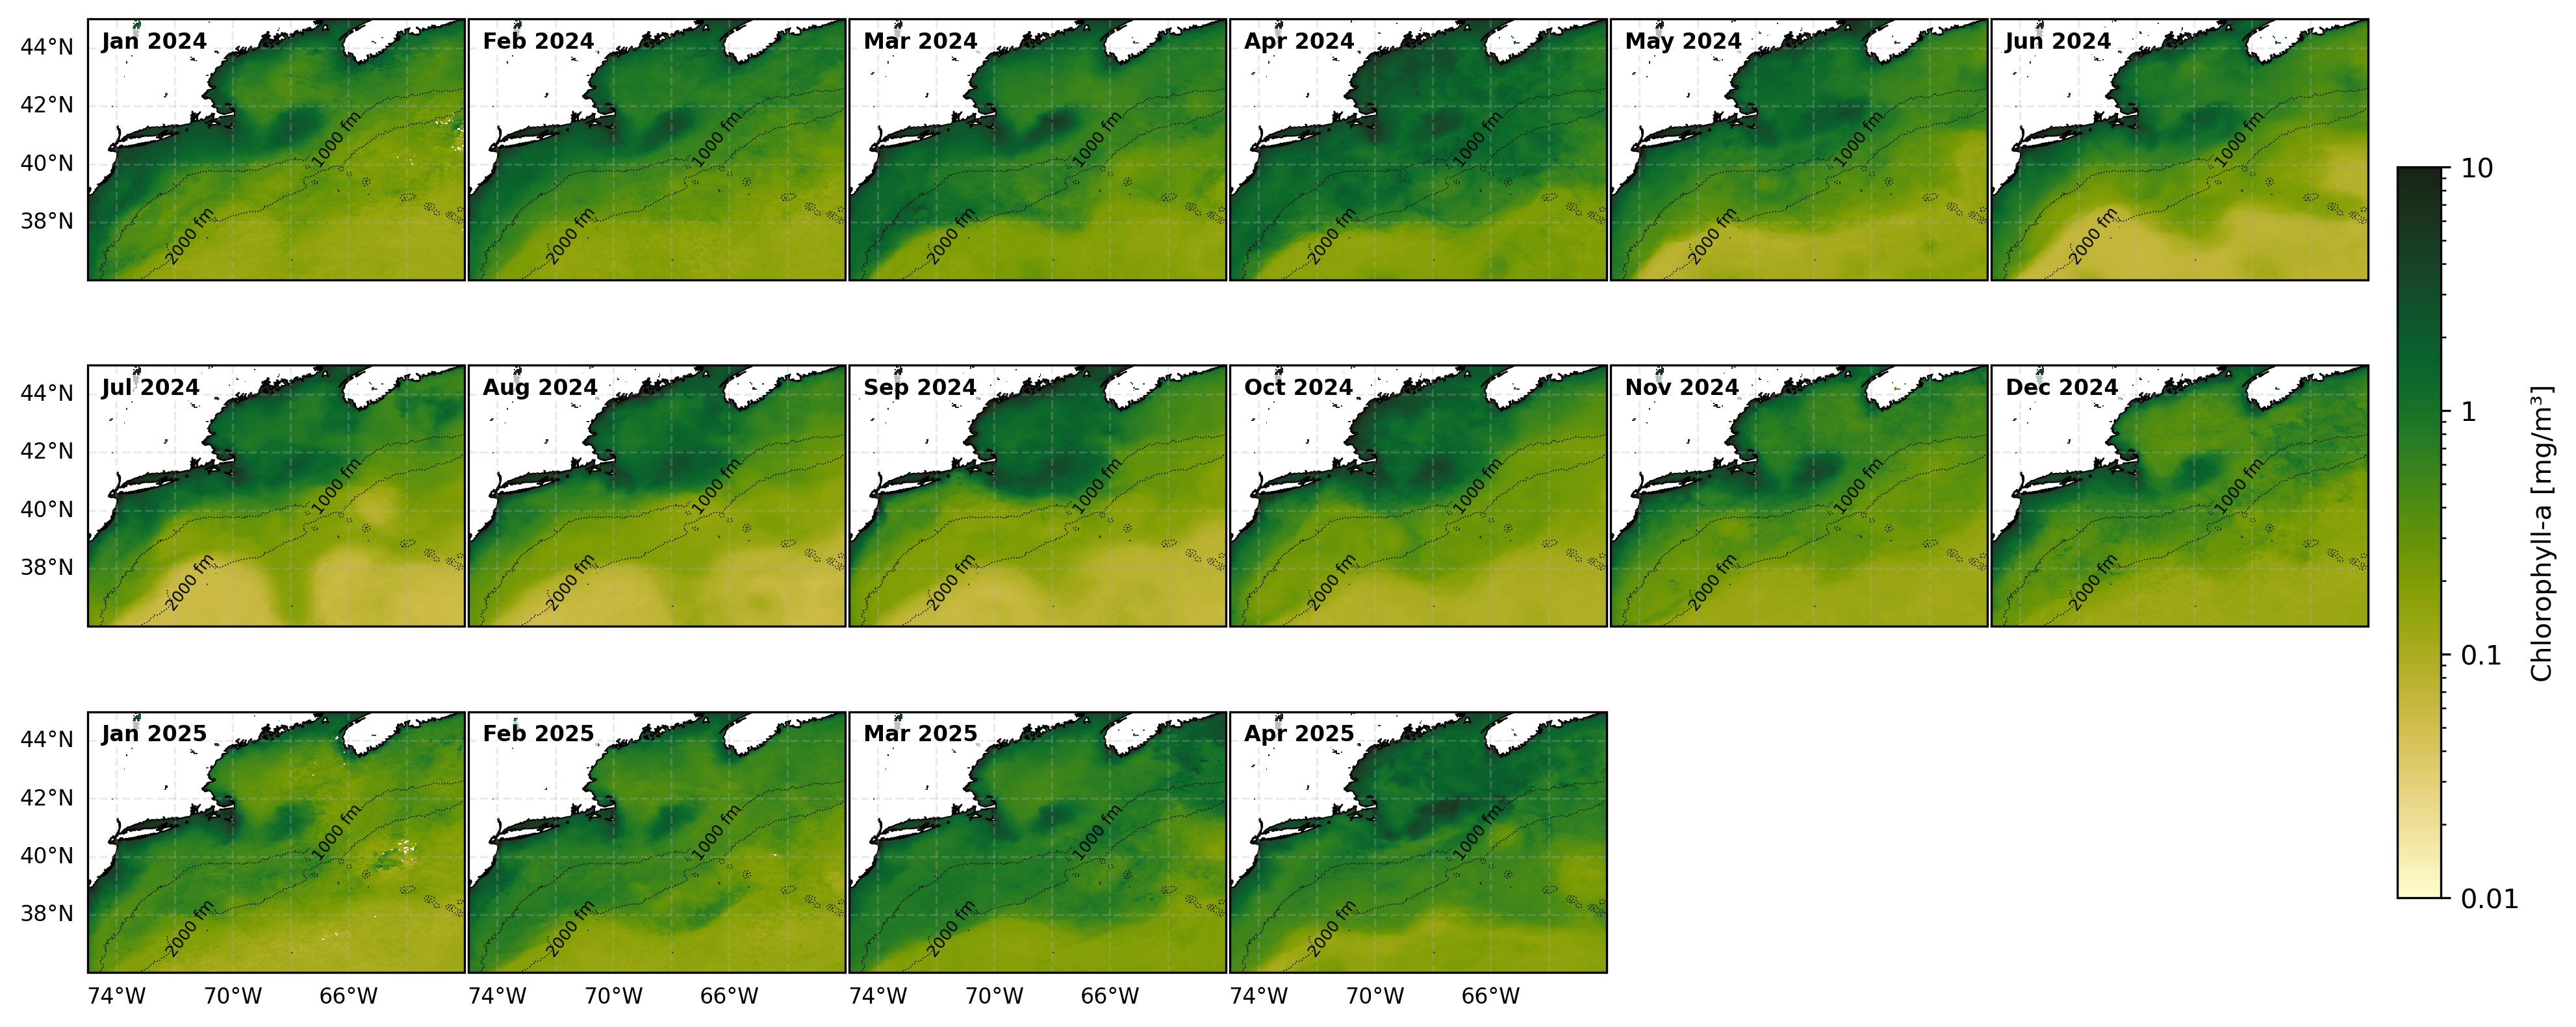
Chlorophyll-a
Monthly average chlorophyll-a concentration from GlobColour satellite data. Chlorophyll-a is measured in milligrams per cubic meter (mg/m³) and serves as a proxy for phytoplankton biomass. Note the plots employ a log scale – slight changes in color can represent large changes in chlorophyll-a concentration.
Long Term Temperature & Salinity Trends
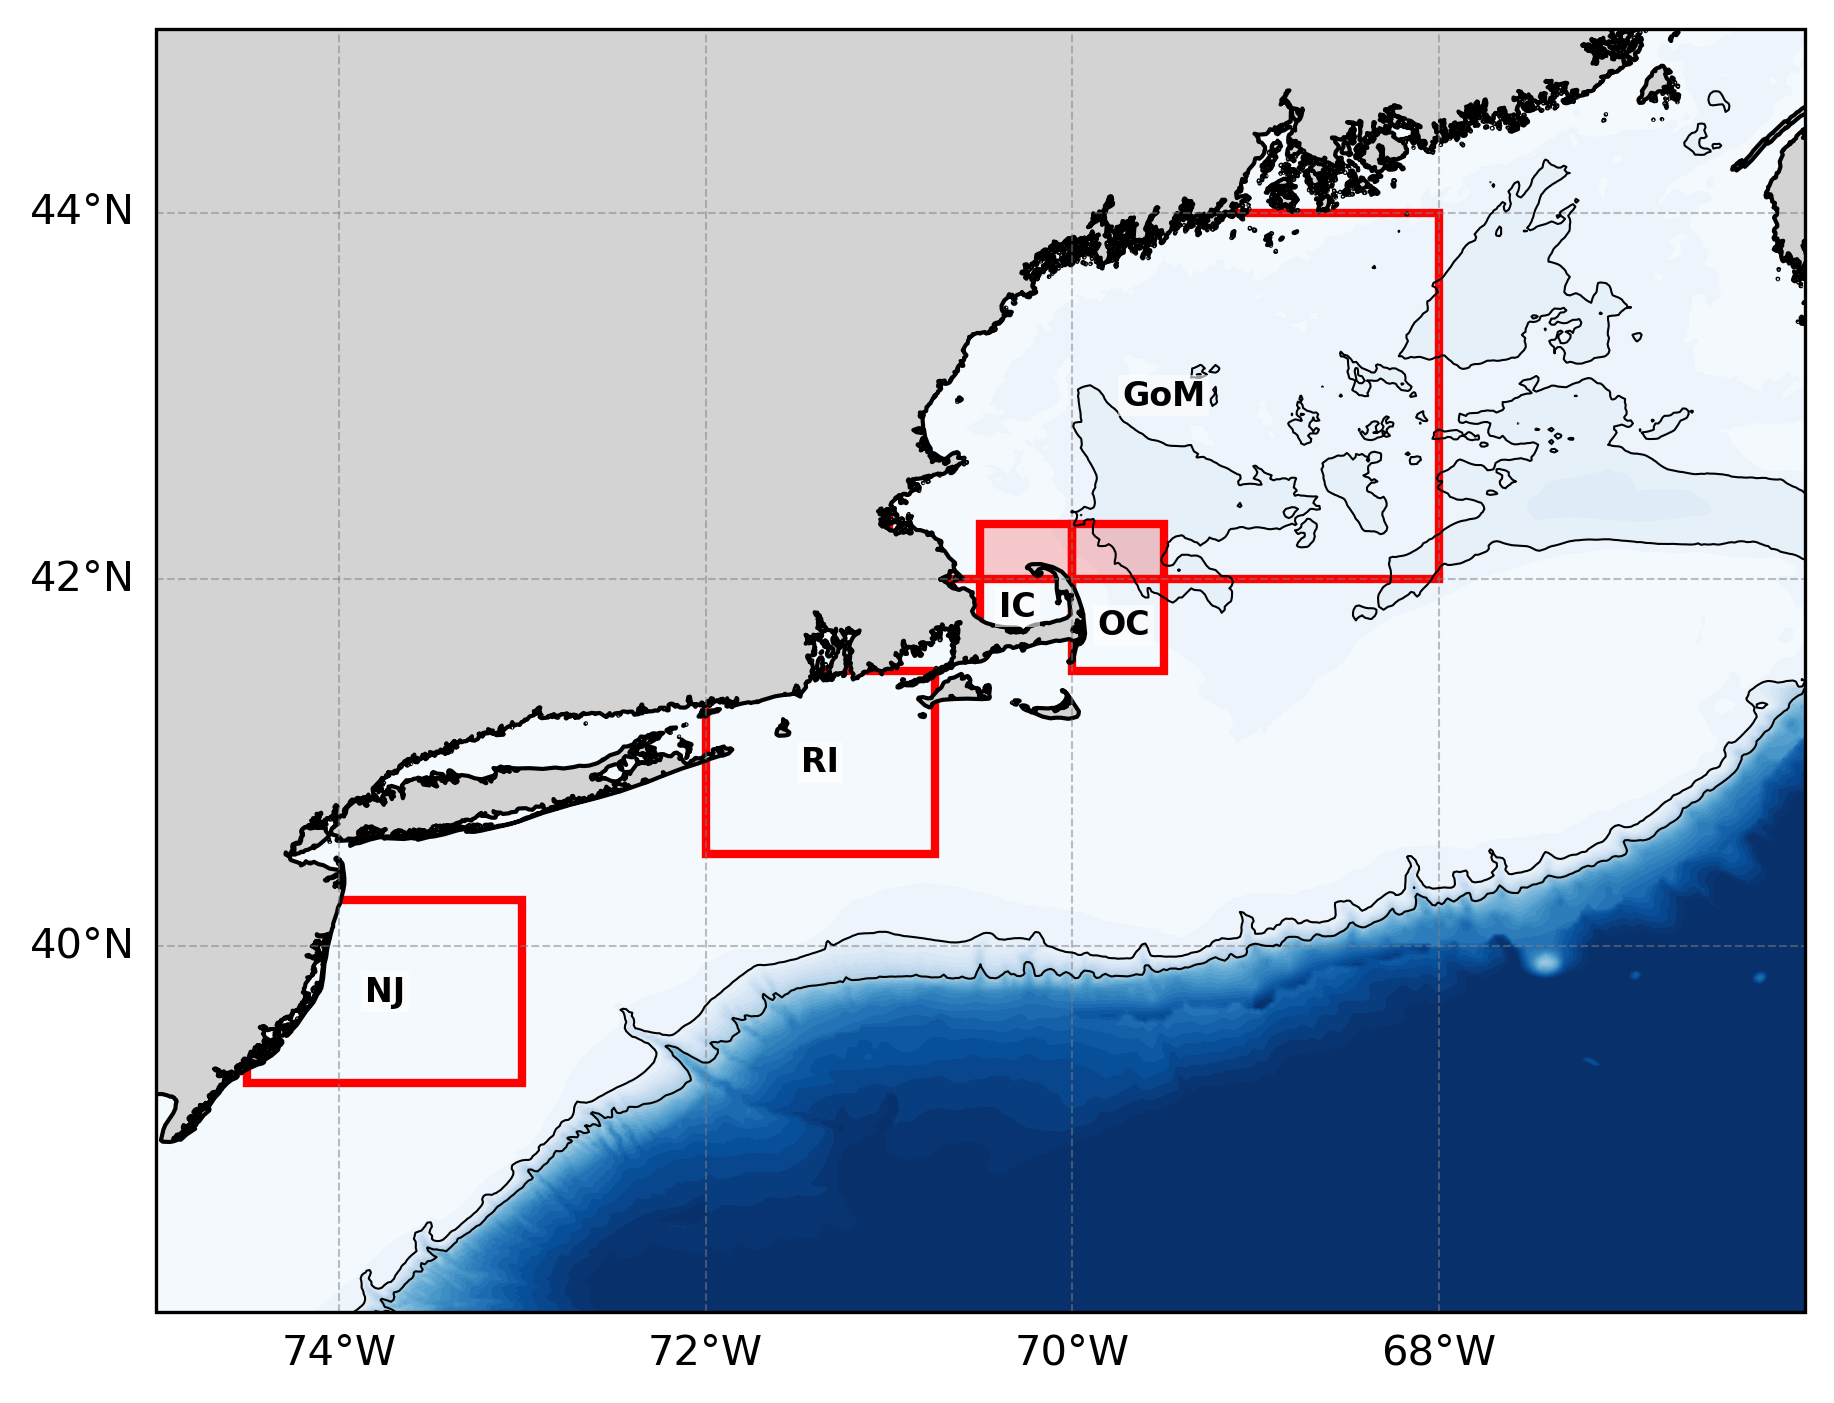
We define five regions of interest, shown in the map below: the Gulf of Maine (GoM), Outer Cape (OC), Inner Cape (IC), Rhode Island (RI), and New Jersey (NJ). The SST/SSS data or anomaly plots further below correspond to these regions. The GoM overlaps with both the OC and IC regions; these overlapping areas are indicated by the shaded regions on the map. For each region, the daily anomaly is calculated as the difference between the region's spatially averaged daily/monthly observed SST/SSS and the long-term mean for that calendar day/month, based on the combined spatial and temporal average across 2007–2024/2016 to 2024 for SST and SSS, respectively. The daily or monthly anomaly is then averaged over the region to produce the region-averaged anomaly.
Regions:
Time Series Plots:
Select a region and data type to view temperature and salinity plots. The temperature plot shows either daily values or anomalies (blue) with a 130-day rolling mean (red) for anomalies. The salinity plot shows monthly values or anomalies.
Sea Surface Temperature Anomaly
Sea Surface Salinity Anomaly
CTD Profiles by Region
Select a region to view monthly CTD profiles for temperature, salinity, and density. The regions referenced here are the same as those used in the anomaly plots above. You can scroll to the right to view more months.